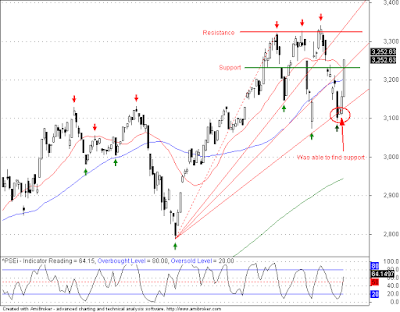
Figure 1. PSE Chart
Our current PSE index is bullish from short to long term view. I'm still bullish because our fibonacci's third support line was not yet breach. Last week our PSE was able to find support in that area.
Overall the PSE trend strength is still weak indicating that there is a possibility that the market will still move sideways. Possible support area can be found at the intersection of our 20 MA and fibonacci line at 3230. While its resistance line still remains at around 3330 and 3340.
Weekly Watchlist: AEV, DMC, JGS, AP, URC, EEI, PCOR, FPH, PIP

No comments:
Post a Comment