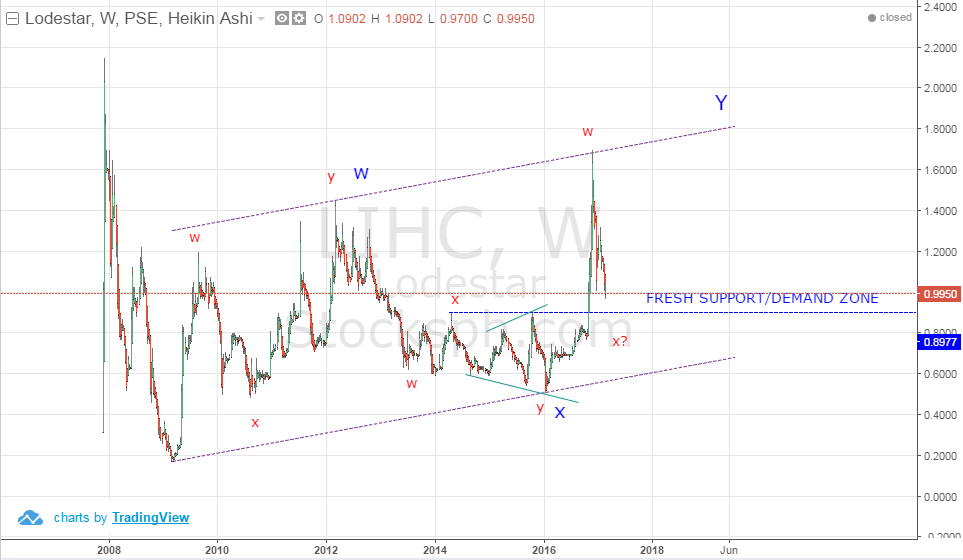
LIHC Weekly Chart
LIHC is forming a complex correction on the weekly chart. A possible double-three pattern. I am eyeing the 0.9000 as fresh area of support/demand for LIHC. If such area holds then its possible LIHC will form a new leg up towards the upper line of the channel (wave Y).

ALCO Weekly Chart
Seems the wave 3 is done for ALCO's rally around 1.80. I believe it will try to rebound but will have less chance to go back to P1.80. P1.80 to P2.0 are key profit taking levels. People who are trap in the correction will most likely exit the ALCO during the rebound. IMHO, very dangerous stock be in right now.
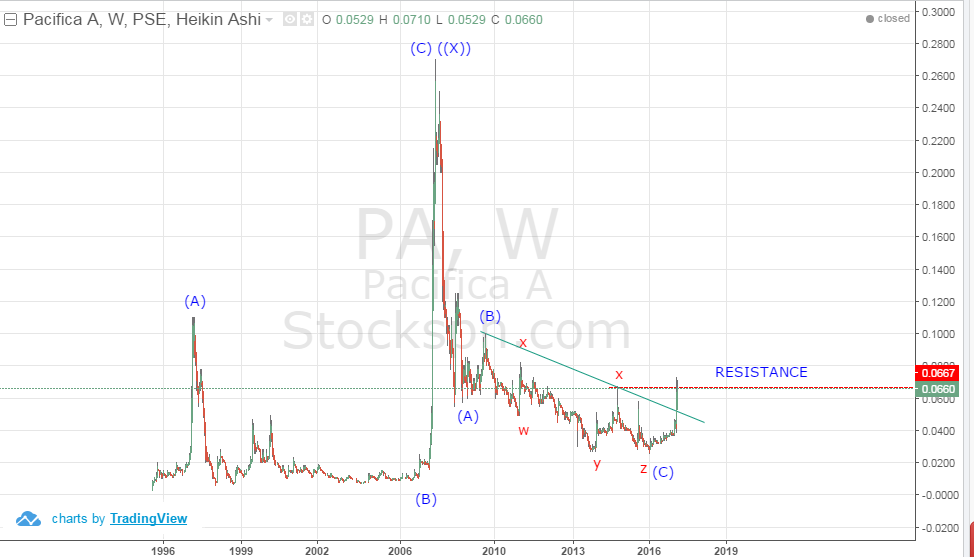
PA Weekly Chart
PA is trying to stage a major rally. Key resistance levels are being penetrated. It needs to break 0.1000 to confirm the count.
DISCLAIMER:
This is just my own personal analysis base on what I see on the chart. It is not a recommendation to buy/sell. Trade at your own risk.
No comments:
Post a Comment